New Junk Bond ETFs
Wednesday February 9, 2011
Today we have 4 new target-date junk bond ETFs from Guggenheim (formerly known as Claymore)...
* BSJC - The Guggenheim Bulletshares 2012 High Yield Corporate Bond ETF
* BSJD - The Guggenheim Bulletshares 2013 High Yield Corporate Bond ETF
* BSJE - The Guggenheim Bulletshares 2014 High Yield Corporate Bond ETF
* BSJF - The Guggenheim Bulletshares 2015 High Yield Corporate Bond ETF
The company had seven similar ETFs launch last June, but they were not high yield corporate bond ETFs like these. And Guggenheim has plans for some more of these target-date ETFs, that extend beyond these years.
There's no doubt junk bond ETFs are popular as of late, but investors must be careful in the analysis and research. And as of today these bond ETFs are trading around $25-$26.
Disclosure NONE
Thursday, February 17, 2011
New Currency-Hedged ETFs Coming Soon
There are 5 new currency-hedged ETFs in the works from Deutsche Bank...
* DBBR - DBX Brazil Currency-Hedged Equity Fund
* DBCN - DBX MSCI Canada Currency-Hedged Fund
* DBEM - DBX MSCI Emerging Markets Currency-Hedged Equity Fund
* DBEF - DBX MSCI EAFE Currency-Hedged Equity Fund
* DBJP - DBX MSCI Japan Currency-Hedged Equity Fund
The strategy behind the new ETFs is utilize forward contracts to keep fluctuations in the price of the currencies under control and minimize the risk.
The new funds are near launch and just recently disclosed their underlying benchmarks. And as you can see, they have their names and symbols. When they are ready to go, I'll be sure to let you know, so stay tuned.
Disclosure none
ETF To Watch: Silver Miners ETF (SIL)

However, the silver market has managed to balance out over the last few weeks posting strong gains thanks to rising inflation fears as well as geopolitical concerns across much of the Middle East. Thanks to this uncertainty, investors in the sector should be paying especially close attention to one of the key companies in the industry, Pan American Silver Corp (PAAS).
PAAS, the Vancouver, Canada-based silver mining giant was scheduled to report its Q4 results after the bell on Tuesday and it also looks to host a conference call during market hours today to discuss the results. Although results were not disclosed at the time of writing, analysts expect the company to post earnings of 46 cents a share, a 15 cent increase from the year ago period, reflecting the rapid increase in the price of silver since the company reported its Q4 2009 numbers
Thanks to this key earnings report from one of the biggest pure silver miners in the world, we have decided to make the Silver Miners ETF (SIL) today’s ETF to watch. The fund tracks the Solactive Global Silver Miners Index which is designed to reflect the performance of the silver mining industry. It is comprised of common stocks, ADRs and GDRs of selected companies globally that are actively engaged in some aspect of the silver mining industry such as silver mining, refining or exploration.
In addition to its 10% weighting in PAAS, the fund also gives high weightings to Industrias Pensoles SAB, Silver Wheaton, and Fresnillio, three other companies that make up at least 10% of SIL’s total assets. Over the past 52 weeks, SIL has surged by a remarkable 65.7% including a 64% gain over the past half year period. However, the fund has lost close to 10% in 2011 but it has posted a solid February, gaining 8.1% back in just two weeks. Should PAAS deliver with solid results and an optimistic outlook, the February run could easily continue into this week as well. If, however, PAAS is unable to match Street expectations, the Canadian company– as well as the broad silver mining industry– could see a quick return to the January 2011 environment in which precious metal miners were under significant pressure.

Disclosure I am Long SIL shares.
U.S. Small Cap Blend ETF Rankings
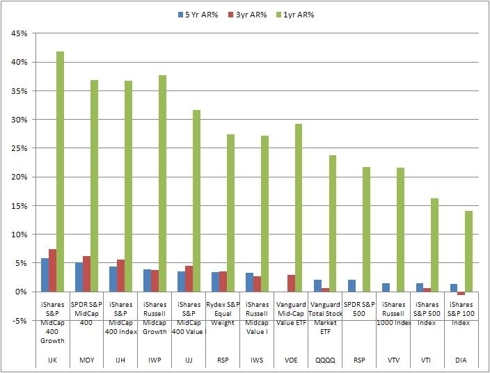
In this article, we start with our US Small Cap ETF rankings. We have already completed large and medium cap ETFs and have derived a performance graph for the ones we selected to potentially use in an ETF plan.
click to enlarge
In this article, we move on to small cap blend ETFs with the goal of providing the same ranking.
We rank and determine a cutoff based on trading volume for liquidity and lowtrading friction, then rank them based on their returns and assign a score. We start with a fuller list of small cap blend ETFs:
We now apply trading volume data for us to be able to reduce the number of ETFs that we examine. We want to make sure we maximize liquidity and minimize trading friction. We are going to draw the line at around 200,000 although we will let the Schwab ETF squeak in just under the bar at around 190,000. This gives us five ETFs.
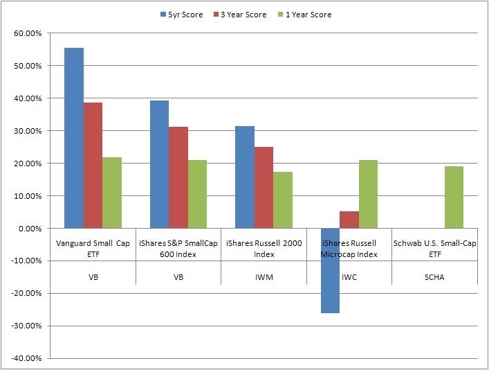
We will select the top three although VB and IJR seem to be head and shoulders above the rest of the bunch.
So VB and IJR are selected for Mid Cap Blend ETFs.
I have no positions in any stocks mentioned, but plan to initiate a long position in IWM over the next 72 hours.
click to enlarge
In this article, we move on to small cap blend ETFs with the goal of providing the same ranking.
We rank and determine a cutoff based on trading volume for liquidity and lowtrading friction, then rank them based on their returns and assign a score. We start with a fuller list of small cap blend ETFs:
| Symbol | Name |
| IWM | iShares Russell 2000 Index |
| IJR | iShares S&P SmallCap 600 Index |
| VB | Vanguard Small Cap ETF |
| IWC | iShares Russell Microcap Index |
| SCHA | Schwab U.S. Small-Cap ETF |
| PRFZ | PowerShares FTSE RAFI US 1500 |
| JKJ | iShares Morningstar Small Core |
| RWJ | RevenueShares Small Cap |
| PZI | PowerShares Zacks Micro Cap |
| FYX | First Trust Small Cap Core Alp |
| FDM | First Trust Dow Jones Select M |
| SLY | SPDR S&P 600 Small Cap ETF |
| WMCR | Wilshire Micro-Cap ETF |
| VTWO | Vanguard Russell 2000 Index ET |
| PJM | PowerShares Dynamic Small Cap |
| EWRS | Rydex Russell 2000 Equal Weigh |
| VIOO | Vanguard S&P Small-Cap 600 Ind |
| Ticker | Description | 5 Yr AR% | 3yr AR% | 1yr AR% |
| VB | Vanguard Small Cap ETF | 4.00% | 5.40% | 37.07% |
| IJR | iShares S&P SmallCap 600 Idx | 2.83% | 4.37% | 35.61% |
| IWM | iShares Russell 2000 Index | 2.26% | 3.50% | 29.63% |
| IWC | iShares Russell Microcap Index | -1.89% | 0.74% | 35.77% |
| SCHA | Schwab U.S. Small-Cap ETF | 0.00% | 0.00% | 32.36% |

We will select the top three although VB and IJR seem to be head and shoulders above the rest of the bunch.
| Ticker | Property | 2004 | 2005 | 2006 | 2007 | 2008 | 2009 | 2010 | 2011 |
| VB | Draw Down(%) | 12.00 | 9.04 | 13.15 | 13.31 | 51.92 | 32.54 | 20.01 | 3.69 |
| Return(%) | 15.29 | 7.10 | 15.50 | 0.96 | (37.61) | 36.39 | 28.58 | 3.19 | |
| IJR | Draw Down(%) | 11.07 | 10.94 | 13.98 | 14.44 | 48.42 | 33.34 | 19.29 | 3.58 |
| Return(%) | 21.43 | 6.57 | 14.17 | (1.47) | (31.70) | 24.45 | 27.33 | 2.13 | |
| IWM | Draw Down(%) | 14.41 | 12.16 | 14.14 | 13.90 | 49.44 | 32.90 | 20.09 | 4.23 |
| Return(%) | 16.88 | 3.04 | 16.95 | (2.73) | (34.48) | 26.81 | 26.49 | 1.55 |
So VB and IJR are selected for Mid Cap Blend ETFs.
I have no positions in any stocks mentioned, but plan to initiate a long position in IWM over the next 72 hours.
Sunday, February 13, 2011
BlackRock Cuts Expenses On 34 ETFs
BlackRock, parent of the world’s biggest exchange-traded fund firm, iShares, cut expense ratios on 34 ETFs, all of them foreign equity funds, including the huge iShares MSCI Emerging Markets Index Fund (NYSEArca: EEM). The changes reflect growing assets in the funds and increased investor interest in international funds.
The funds’ prospectuses stipulate that expense ratios on the funds should decrease as assets under management grow. All the reductions were effective on Jan. 1. The company cut EEM’s expense ratio to 0.69 percent from 0.72 percent previously. Some of the changes are also related to changes in foreign taxes, the company said.
“The changes are a reflection of breakpoints being triggered,” Christine Hudacko, a spokeswoman at San Francisco-based iShares, said in a telephone interview.
The fact that so many of the affected funds are foreign—many of them country-specific in the emerging markets—reflects how much U.S. investors are getting over their home-country bias and scouring the planet for returns. EEM, for example, had net inflows of $2.28 billion in 2010 and ended the year with $47.46 billion in assets, making it the single-biggest broad-based emerging markets fund.
Among the more well-known single-country funds, prices of which iShares happened to cut to 0.61 percent from 0.65 percent, are:
- iShares MSCI Chile Investable Market Index Fund (NYSEArca: ECH), which almost doubled in size in 2010 and ended the year with about $1 billion in assets;
- iShares MSCI South Korea Index Fund (NYSEArca: EWY), which ended the year with $4.17 billion in assets after gathering $333.3 million in new investment last year;
- iShares MSCI Brazil Index Fund (NYSEArca: EWZ), which added net assets of $530 million and ended the year with more than $11 billion in assets; and
- iShares MSCI Turkey Investable Market Index Fund (NYSEArca: TUR), which added $308 million to end the year at $787 million.
All the changes are in the table below:
| Fund Name | Previous Expense Ratio | New Expense Ratio | Difference | Reason for Difference/General Notes |
| iShares, Inc. | ||||
| iShares MSCI Australia Index Fund (NYSEArca: EWA) | 0.55% | 0.53% | 0.02% | |
| iShares MSCI Austria Investable Market Index Fund (NYSEArca: EWO) | 0.55% | 0.54% | 0.01% | |
| iShares MSCI Belgium Investable Market Index Fund (NYSEArca: EWK) | 0.56% | 0.54% | 0.02% | |
| iShares MSCI Brazil Index Fund (NYSEArca: EWZ) | 0.65% | 0.61% | 0.04% | |
| iShares MSCI BRIC Index Fund NYSEArca: BKF) | 0.72% | 0.69% | 0.03% | |
| iShares MSCI Canada Index Fund (NYSEArca: EWC) | 0.55% | 0.53% | 0.02% | |
| iShares MSCI Chile Investable Market Index Fund (NYSEArca: ECH) | 0.65% | 0.61% | 0.04% | |
| iShares MSCI Emerging Markets Eastern Europe Index Fund (NYSEArca: ESR) | 0.72% | 0.69% | 0.03% | |
| iShares MSCI Emerging Markets Index Fund (NYSEArca: EEM) | 0.72% | 0.69% | 0.03% | 0.01% in foreign taxes |
| iShares MSCI EMU Index Fund NYSEArca: EZU) | 0.56% | 0.54% | 0.02% | |
| iShares MSCI France Index Fund (NYSEArca: EWQ) | 0.55% | 0.54% | 0.01% | 0.01% in foreign taxes |
| iShares MSCI Germany Index Fund (NYSEArca: EWG) | 0.55% | 0.53% | 0.02% | |
| iShares MSCI Hong Kong Index Fund (NYSEArca: EWH) | 0.55% | 0.53% | 0.02% | |
| iShares MSCI Israel Capped Investable Market Index Fund (NYSEArca: EIS) | 0.66% | 0.61% | 0.05% | |
| iShares MSCI Italy Index Fund (NYSEArca: EWI) | 0.59% | 0.54% | 0.05% | change in foreign taxes from 0.04% to 0.00% |
| iShares MSCI Japan Index Fund (NYSEArca: EWJ) | 0.56% | 0.54% | 0.02% | |
| iShares MSCI Japan Small Cap Index Fund (NYSEArca: SCJ) | 0.56% | 0.53% | 0.03% | |
| iShares MSCI Malaysia Index Fund (NYSEArca: EWM) | 0.56% | 0.53% | 0.03% | |
| iShares MSCI Mexico Investable Market Index Fund (NYSEArca: EWW | 0.55% | 0.53% | 0.02% | |
| iShares MSCI Netherlands Investable Market Index Fund (NYSEArca: WN) | 0.55% | 0.53% | 0.02% | |
| iShares MSCI Singapore Index Fund (NYSEArca: EWS) | 0.55% | 0.53% | 0.02% | |
| iShares MSCI South Africa Index Fund (NYSEArca: EZA) | 0.66% | 0.61% | 0.05% | |
| iShares MSCI South Korea Index Fund (NYSEArca: EWY) | 0.65% | 0.61% | 0.04% | |
| iShares MSCI Spain Index Fund (NYSEArca: EWP) | 0.56% | 0.54% | 0.02% | |
| iShares MSCI Sweden Index Fund (NYSEArca: EWD) | 0.55% | 0.53% | 0.02% | |
| iShares MSCI Switzerland Index Fund (NYSEArca: EWL) | 0.56% | 0.53% | 0.03% | |
| iShares MSCI Taiwan Index Fund (NYSEArca: EWT) | 0.82% | 0.71% | 0.11% | change in foreign taxes from 0.17% to 0.10% |
| iShares MSCI Thailand Investable Market Index Fund (NYSEArca: THD) | 0.65% | 0.62% | 0.03% | 0.01% in foreign taxes |
| iShares MSCI Turkey Investable Market Index Fund (NYSEArca: TUR) | 0.65% | 0.61% | 0.04% | |
| iShares MSCI United Kingdom Index Fund (NYSEArca: EWU) | 0.55% | 0.53% | 0.02% | |
| iShares Trust | ||||
| iShares MSCI All Peru Capped Index Fund (NYSEArca: EPU) | 0.63% | 0.62% | 0.01% | 0.01% foreign taxes |
| iShares MSCI Indonesia Investable Market Index Fund (NYSEArca: EIDO) | 0.65% | 0.61% | 0.04% | |
| iShares MSCI Ireland Capped Investable Market Index Fund (NYSEArca: EIRL) | 0.55% | 0.53% | 0.02% | |
| iShares MSCI Poland Investable Market Index Fund (NYSEArca: EPOL) | 0.65% | 0.61% | 0.04% | |
Information provided by iShares
Disclosure None
Subscribe to:
Posts (Atom)