New Junk Bond ETFs
Wednesday February 9, 2011
Today we have 4 new target-date junk bond ETFs from Guggenheim (formerly known as Claymore)...
* BSJC - The Guggenheim Bulletshares 2012 High Yield Corporate Bond ETF
* BSJD - The Guggenheim Bulletshares 2013 High Yield Corporate Bond ETF
* BSJE - The Guggenheim Bulletshares 2014 High Yield Corporate Bond ETF
* BSJF - The Guggenheim Bulletshares 2015 High Yield Corporate Bond ETF
The company had seven similar ETFs launch last June, but they were not high yield corporate bond ETFs like these. And Guggenheim has plans for some more of these target-date ETFs, that extend beyond these years.
There's no doubt junk bond ETFs are popular as of late, but investors must be careful in the analysis and research. And as of today these bond ETFs are trading around $25-$26.
Disclosure NONE
Thursday, February 17, 2011
New Currency-Hedged ETFs Coming Soon
There are 5 new currency-hedged ETFs in the works from Deutsche Bank...
* DBBR - DBX Brazil Currency-Hedged Equity Fund
* DBCN - DBX MSCI Canada Currency-Hedged Fund
* DBEM - DBX MSCI Emerging Markets Currency-Hedged Equity Fund
* DBEF - DBX MSCI EAFE Currency-Hedged Equity Fund
* DBJP - DBX MSCI Japan Currency-Hedged Equity Fund
The strategy behind the new ETFs is utilize forward contracts to keep fluctuations in the price of the currencies under control and minimize the risk.
The new funds are near launch and just recently disclosed their underlying benchmarks. And as you can see, they have their names and symbols. When they are ready to go, I'll be sure to let you know, so stay tuned.
Disclosure none
ETF To Watch: Silver Miners ETF (SIL)

However, the silver market has managed to balance out over the last few weeks posting strong gains thanks to rising inflation fears as well as geopolitical concerns across much of the Middle East. Thanks to this uncertainty, investors in the sector should be paying especially close attention to one of the key companies in the industry, Pan American Silver Corp (PAAS).
PAAS, the Vancouver, Canada-based silver mining giant was scheduled to report its Q4 results after the bell on Tuesday and it also looks to host a conference call during market hours today to discuss the results. Although results were not disclosed at the time of writing, analysts expect the company to post earnings of 46 cents a share, a 15 cent increase from the year ago period, reflecting the rapid increase in the price of silver since the company reported its Q4 2009 numbers
Thanks to this key earnings report from one of the biggest pure silver miners in the world, we have decided to make the Silver Miners ETF (SIL) today’s ETF to watch. The fund tracks the Solactive Global Silver Miners Index which is designed to reflect the performance of the silver mining industry. It is comprised of common stocks, ADRs and GDRs of selected companies globally that are actively engaged in some aspect of the silver mining industry such as silver mining, refining or exploration.
In addition to its 10% weighting in PAAS, the fund also gives high weightings to Industrias Pensoles SAB, Silver Wheaton, and Fresnillio, three other companies that make up at least 10% of SIL’s total assets. Over the past 52 weeks, SIL has surged by a remarkable 65.7% including a 64% gain over the past half year period. However, the fund has lost close to 10% in 2011 but it has posted a solid February, gaining 8.1% back in just two weeks. Should PAAS deliver with solid results and an optimistic outlook, the February run could easily continue into this week as well. If, however, PAAS is unable to match Street expectations, the Canadian company– as well as the broad silver mining industry– could see a quick return to the January 2011 environment in which precious metal miners were under significant pressure.

Disclosure I am Long SIL shares.
U.S. Small Cap Blend ETF Rankings
In this article, we start with our US Small Cap ETF rankings. We have already completed large and medium cap ETFs and have derived a performance graph for the ones we selected to potentially use in an ETF plan.
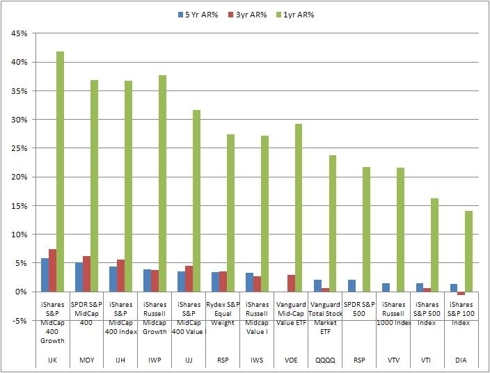
click to enlarge
In this article, we move on to small cap blend ETFs with the goal of providing the same ranking.
We rank and determine a cutoff based on trading volume for liquidity and lowtrading friction, then rank them based on their returns and assign a score. We start with a fuller list of small cap blend ETFs:
We now apply trading volume data for us to be able to reduce the number of ETFs that we examine. We want to make sure we maximize liquidity and minimize trading friction. We are going to draw the line at around 200,000 although we will let the Schwab ETF squeak in just under the bar at around 190,000. This gives us five ETFs.
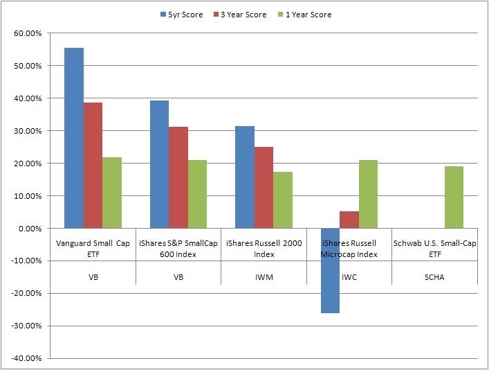
We will select the top three although VB and IJR seem to be head and shoulders above the rest of the bunch.
So VB and IJR are selected for Mid Cap Blend ETFs.
I have no positions in any stocks mentioned, but plan to initiate a long position in IWM over the next 72 hours.
click to enlarge
In this article, we move on to small cap blend ETFs with the goal of providing the same ranking.
We rank and determine a cutoff based on trading volume for liquidity and lowtrading friction, then rank them based on their returns and assign a score. We start with a fuller list of small cap blend ETFs:
| Symbol | Name |
| IWM | iShares Russell 2000 Index |
| IJR | iShares S&P SmallCap 600 Index |
| VB | Vanguard Small Cap ETF |
| IWC | iShares Russell Microcap Index |
| SCHA | Schwab U.S. Small-Cap ETF |
| PRFZ | PowerShares FTSE RAFI US 1500 |
| JKJ | iShares Morningstar Small Core |
| RWJ | RevenueShares Small Cap |
| PZI | PowerShares Zacks Micro Cap |
| FYX | First Trust Small Cap Core Alp |
| FDM | First Trust Dow Jones Select M |
| SLY | SPDR S&P 600 Small Cap ETF |
| WMCR | Wilshire Micro-Cap ETF |
| VTWO | Vanguard Russell 2000 Index ET |
| PJM | PowerShares Dynamic Small Cap |
| EWRS | Rydex Russell 2000 Equal Weigh |
| VIOO | Vanguard S&P Small-Cap 600 Ind |
| Ticker | Description | 5 Yr AR% | 3yr AR% | 1yr AR% |
| VB | Vanguard Small Cap ETF | 4.00% | 5.40% | 37.07% |
| IJR | iShares S&P SmallCap 600 Idx | 2.83% | 4.37% | 35.61% |
| IWM | iShares Russell 2000 Index | 2.26% | 3.50% | 29.63% |
| IWC | iShares Russell Microcap Index | -1.89% | 0.74% | 35.77% |
| SCHA | Schwab U.S. Small-Cap ETF | 0.00% | 0.00% | 32.36% |

We will select the top three although VB and IJR seem to be head and shoulders above the rest of the bunch.
| Ticker | Property | 2004 | 2005 | 2006 | 2007 | 2008 | 2009 | 2010 | 2011 |
| VB | Draw Down(%) | 12.00 | 9.04 | 13.15 | 13.31 | 51.92 | 32.54 | 20.01 | 3.69 |
| Return(%) | 15.29 | 7.10 | 15.50 | 0.96 | (37.61) | 36.39 | 28.58 | 3.19 | |
| IJR | Draw Down(%) | 11.07 | 10.94 | 13.98 | 14.44 | 48.42 | 33.34 | 19.29 | 3.58 |
| Return(%) | 21.43 | 6.57 | 14.17 | (1.47) | (31.70) | 24.45 | 27.33 | 2.13 | |
| IWM | Draw Down(%) | 14.41 | 12.16 | 14.14 | 13.90 | 49.44 | 32.90 | 20.09 | 4.23 |
| Return(%) | 16.88 | 3.04 | 16.95 | (2.73) | (34.48) | 26.81 | 26.49 | 1.55 |
So VB and IJR are selected for Mid Cap Blend ETFs.
I have no positions in any stocks mentioned, but plan to initiate a long position in IWM over the next 72 hours.
Sunday, February 13, 2011
BlackRock Cuts Expenses On 34 ETFs
BlackRock, parent of the world’s biggest exchange-traded fund firm, iShares, cut expense ratios on 34 ETFs, all of them foreign equity funds, including the huge iShares MSCI Emerging Markets Index Fund (NYSEArca: EEM). The changes reflect growing assets in the funds and increased investor interest in international funds.
The funds’ prospectuses stipulate that expense ratios on the funds should decrease as assets under management grow. All the reductions were effective on Jan. 1. The company cut EEM’s expense ratio to 0.69 percent from 0.72 percent previously. Some of the changes are also related to changes in foreign taxes, the company said.
“The changes are a reflection of breakpoints being triggered,” Christine Hudacko, a spokeswoman at San Francisco-based iShares, said in a telephone interview.
The fact that so many of the affected funds are foreign—many of them country-specific in the emerging markets—reflects how much U.S. investors are getting over their home-country bias and scouring the planet for returns. EEM, for example, had net inflows of $2.28 billion in 2010 and ended the year with $47.46 billion in assets, making it the single-biggest broad-based emerging markets fund.
Among the more well-known single-country funds, prices of which iShares happened to cut to 0.61 percent from 0.65 percent, are:
- iShares MSCI Chile Investable Market Index Fund (NYSEArca: ECH), which almost doubled in size in 2010 and ended the year with about $1 billion in assets;
- iShares MSCI South Korea Index Fund (NYSEArca: EWY), which ended the year with $4.17 billion in assets after gathering $333.3 million in new investment last year;
- iShares MSCI Brazil Index Fund (NYSEArca: EWZ), which added net assets of $530 million and ended the year with more than $11 billion in assets; and
- iShares MSCI Turkey Investable Market Index Fund (NYSEArca: TUR), which added $308 million to end the year at $787 million.
All the changes are in the table below:
| Fund Name | Previous Expense Ratio | New Expense Ratio | Difference | Reason for Difference/General Notes |
| iShares, Inc. | ||||
| iShares MSCI Australia Index Fund (NYSEArca: EWA) | 0.55% | 0.53% | 0.02% | |
| iShares MSCI Austria Investable Market Index Fund (NYSEArca: EWO) | 0.55% | 0.54% | 0.01% | |
| iShares MSCI Belgium Investable Market Index Fund (NYSEArca: EWK) | 0.56% | 0.54% | 0.02% | |
| iShares MSCI Brazil Index Fund (NYSEArca: EWZ) | 0.65% | 0.61% | 0.04% | |
| iShares MSCI BRIC Index Fund NYSEArca: BKF) | 0.72% | 0.69% | 0.03% | |
| iShares MSCI Canada Index Fund (NYSEArca: EWC) | 0.55% | 0.53% | 0.02% | |
| iShares MSCI Chile Investable Market Index Fund (NYSEArca: ECH) | 0.65% | 0.61% | 0.04% | |
| iShares MSCI Emerging Markets Eastern Europe Index Fund (NYSEArca: ESR) | 0.72% | 0.69% | 0.03% | |
| iShares MSCI Emerging Markets Index Fund (NYSEArca: EEM) | 0.72% | 0.69% | 0.03% | 0.01% in foreign taxes |
| iShares MSCI EMU Index Fund NYSEArca: EZU) | 0.56% | 0.54% | 0.02% | |
| iShares MSCI France Index Fund (NYSEArca: EWQ) | 0.55% | 0.54% | 0.01% | 0.01% in foreign taxes |
| iShares MSCI Germany Index Fund (NYSEArca: EWG) | 0.55% | 0.53% | 0.02% | |
| iShares MSCI Hong Kong Index Fund (NYSEArca: EWH) | 0.55% | 0.53% | 0.02% | |
| iShares MSCI Israel Capped Investable Market Index Fund (NYSEArca: EIS) | 0.66% | 0.61% | 0.05% | |
| iShares MSCI Italy Index Fund (NYSEArca: EWI) | 0.59% | 0.54% | 0.05% | change in foreign taxes from 0.04% to 0.00% |
| iShares MSCI Japan Index Fund (NYSEArca: EWJ) | 0.56% | 0.54% | 0.02% | |
| iShares MSCI Japan Small Cap Index Fund (NYSEArca: SCJ) | 0.56% | 0.53% | 0.03% | |
| iShares MSCI Malaysia Index Fund (NYSEArca: EWM) | 0.56% | 0.53% | 0.03% | |
| iShares MSCI Mexico Investable Market Index Fund (NYSEArca: EWW | 0.55% | 0.53% | 0.02% | |
| iShares MSCI Netherlands Investable Market Index Fund (NYSEArca: WN) | 0.55% | 0.53% | 0.02% | |
| iShares MSCI Singapore Index Fund (NYSEArca: EWS) | 0.55% | 0.53% | 0.02% | |
| iShares MSCI South Africa Index Fund (NYSEArca: EZA) | 0.66% | 0.61% | 0.05% | |
| iShares MSCI South Korea Index Fund (NYSEArca: EWY) | 0.65% | 0.61% | 0.04% | |
| iShares MSCI Spain Index Fund (NYSEArca: EWP) | 0.56% | 0.54% | 0.02% | |
| iShares MSCI Sweden Index Fund (NYSEArca: EWD) | 0.55% | 0.53% | 0.02% | |
| iShares MSCI Switzerland Index Fund (NYSEArca: EWL) | 0.56% | 0.53% | 0.03% | |
| iShares MSCI Taiwan Index Fund (NYSEArca: EWT) | 0.82% | 0.71% | 0.11% | change in foreign taxes from 0.17% to 0.10% |
| iShares MSCI Thailand Investable Market Index Fund (NYSEArca: THD) | 0.65% | 0.62% | 0.03% | 0.01% in foreign taxes |
| iShares MSCI Turkey Investable Market Index Fund (NYSEArca: TUR) | 0.65% | 0.61% | 0.04% | |
| iShares MSCI United Kingdom Index Fund (NYSEArca: EWU) | 0.55% | 0.53% | 0.02% | |
| iShares Trust | ||||
| iShares MSCI All Peru Capped Index Fund (NYSEArca: EPU) | 0.63% | 0.62% | 0.01% | 0.01% foreign taxes |
| iShares MSCI Indonesia Investable Market Index Fund (NYSEArca: EIDO) | 0.65% | 0.61% | 0.04% | |
| iShares MSCI Ireland Capped Investable Market Index Fund (NYSEArca: EIRL) | 0.55% | 0.53% | 0.02% | |
| iShares MSCI Poland Investable Market Index Fund (NYSEArca: EPOL) | 0.65% | 0.61% | 0.04% | |
Information provided by iShares
Disclosure None
Sunday, January 30, 2011
A Cheaper Dollar Will Open The Door For These Chinese Investments (UUP, MUB, TCK, CCJ, GMO, PWR)
On January 18th and 19th, the top officials of the two most powerful nations on Earth are to meet in matters of far reaching significance. There will be not one but two dinners. One is to be a grand dinner of state with all of the military and business leaders of both sides in attendance. The other is to be an “intimate” dinner. Oh, to be a fly on the wall of that private meeting.
Behind the photo-ops and the speeches there is one basic reality, China and America are joined inseparably at the hip in a single entity, which I am calling “The Chinamese Twins.” As in all such pairings each head can have their own separate and distinct personalities. The fact remains you can call one capitalism and the other communism, but both heads are mutually dependent on a single life support system. The world financial network provides circulatory nourishment to both heads whose interests are complementary.
Washington needs the cheap dollar (NYSE:UUP) to pay off colossal debts. China needs to revalue its Yuan to counter domestic inflation in such areas as food and basic consumer goods. The Chinese have raised interest rates and bank reserve rules, to little avail. At the same time the Chinese do not want to dry up credit which would impede their growing economy or slowdown exports.
A current headline in the Wall St. Journal reads, “The Bank Of China Moves to Make Yuan a Global Currency.” This will come as no surprise to goldstocktrades.com readers. In an article I wrote back in November, I spoke about China and Russia beginning to trade in Yuan and Rubles causing the need for the Yuan to be revalued higher.
The Chinese economy is thriving and they can well afford to revalue the Yuan higher. This stronger yuan will make North American resource assets cheaper and put China in the driver’s seat to control many of the large undeveloped assets. At the same time they are buying gold, silver and uranium assets hand over fist to hedge themselves from a U.S. dollar decline, in which they own the largest interest. In 2009 the Chinese Investment Corporation, a state owned company, took large ownership positions in Teck Cominco (NYSE:TCK) and Penn West Energy Trust (NYSE:PWR). Recently in June, China National Nuclear signed a contract with Cameco (NYSE:CCJ) to supply 23 million pounds of uranium. Hanlong Investments took a large stake in General Moly (AMEX:GMO), one of the leading North American molybdenum developers.
They want more gold and silver to support the Yuan in order to ensure that when the Yuan becomes the major world currency, it will be more resistant to the swings encountered by fiat currencies. Additionally, they also want more precious metals to buttress its fiscal balance sheet and what they feel is the eventual replacement of the U.S. Dollar as the world’s reserve currency. They are also rapidly developing and modernizing increasing their use of uranium, potash, molybdenum, rare earths, coal and oil and gas.
By revaluing the Yuan higher, China will be able to control inflation and rising costs. A higher Yuan will also benefit the Chinese investment side which has already been active making deals in North America. The U.S. dollar will significantly be cheaper for the Chinese which would allow them to acquire North American assets for pennies on the dollar. Just recently the Chinese Investment Corporation, whose focus is to look for investment opportunities abroad opened its first international branch in Toronto, which is the North American epicenter of resource companies. Its one billion plus people can enjoy more purchasing power through a higher yuan and a higher standard of living with a supply of North American natural resources which could fuel their rapid development.
Beyond the blustering and posturing at these dinners the trade off is that they want carte blanche to enter more strongly into the heart of capitalism and the North American resource sector. Here the Chinese can get all the gold, silver and natural resource deals they want. Doors will quietly swing open and everyone will go home happy. The Chinese will have their desired access to buy gold and natural resource stocks, while The Americans receive a weaker dollar with which to pay off their burgeoning debts. If you are thinking that such a Byzantine arrangement can’t be done, be assured it has all happened before. During the 1980’s the USSR sold large amounts of gold secretly in New York. It took three years to become public knowledge.
Another part of this “Chinamese” agreement concerns rare metals, on which the Chinese head wants to maintain its strategic grip of over 95% of the world’s supply. I feel the U.S. will not make this an issue. The U.S. will accommodate China in order to persuade them to raise the Yuan higher and the dollar lower. I feel this revaluation will be done in a series of two or three steps in 2011, which should eventually move precious metals into new high territories and crush the U.S. dollar. Volatile sell offs in gold and silver like I predicted in November and December, which we are currently experiencing now, may present long term precious metal investors with buying opportunities.
Underneath all of the media hype and adversarial stories between China and America, I read a front page story in the New York Times of 1-17-11, “GE To Share Jet Technology With China In A New Joint Venture.” Expect to hear more deals in 2011 in which the Chinese continue to invest in natural resource assets in North America, while the U.S. continues to search for a way out of the financial crisis.
We may see further bailouts from the federal government as many states are in danger of defaulting. The bankrupt states are already asking Washington for assistance. This devaluation of the dollar that Geithner and Obama are asking for is to help the US pay off its debts and be able to raise its debt ceiling with cheap devalued dollars. This should be bullish for precious metal prices where investors will seek shelter from soaring government deficits and a loss of the U.S. dollar as the world reserve currency. See the iShares S&P National AMT-Free Muni Bond ETF (NYSE:MUB) chart below:
 Disclosure None
Behind the photo-ops and the speeches there is one basic reality, China and America are joined inseparably at the hip in a single entity, which I am calling “The Chinamese Twins.” As in all such pairings each head can have their own separate and distinct personalities. The fact remains you can call one capitalism and the other communism, but both heads are mutually dependent on a single life support system. The world financial network provides circulatory nourishment to both heads whose interests are complementary.
Washington needs the cheap dollar (NYSE:UUP) to pay off colossal debts. China needs to revalue its Yuan to counter domestic inflation in such areas as food and basic consumer goods. The Chinese have raised interest rates and bank reserve rules, to little avail. At the same time the Chinese do not want to dry up credit which would impede their growing economy or slowdown exports.
A current headline in the Wall St. Journal reads, “The Bank Of China Moves to Make Yuan a Global Currency.” This will come as no surprise to goldstocktrades.com readers. In an article I wrote back in November, I spoke about China and Russia beginning to trade in Yuan and Rubles causing the need for the Yuan to be revalued higher.
The Chinese economy is thriving and they can well afford to revalue the Yuan higher. This stronger yuan will make North American resource assets cheaper and put China in the driver’s seat to control many of the large undeveloped assets. At the same time they are buying gold, silver and uranium assets hand over fist to hedge themselves from a U.S. dollar decline, in which they own the largest interest. In 2009 the Chinese Investment Corporation, a state owned company, took large ownership positions in Teck Cominco (NYSE:TCK) and Penn West Energy Trust (NYSE:PWR). Recently in June, China National Nuclear signed a contract with Cameco (NYSE:CCJ) to supply 23 million pounds of uranium. Hanlong Investments took a large stake in General Moly (AMEX:GMO), one of the leading North American molybdenum developers.
They want more gold and silver to support the Yuan in order to ensure that when the Yuan becomes the major world currency, it will be more resistant to the swings encountered by fiat currencies. Additionally, they also want more precious metals to buttress its fiscal balance sheet and what they feel is the eventual replacement of the U.S. Dollar as the world’s reserve currency. They are also rapidly developing and modernizing increasing their use of uranium, potash, molybdenum, rare earths, coal and oil and gas.
By revaluing the Yuan higher, China will be able to control inflation and rising costs. A higher Yuan will also benefit the Chinese investment side which has already been active making deals in North America. The U.S. dollar will significantly be cheaper for the Chinese which would allow them to acquire North American assets for pennies on the dollar. Just recently the Chinese Investment Corporation, whose focus is to look for investment opportunities abroad opened its first international branch in Toronto, which is the North American epicenter of resource companies. Its one billion plus people can enjoy more purchasing power through a higher yuan and a higher standard of living with a supply of North American natural resources which could fuel their rapid development.
Beyond the blustering and posturing at these dinners the trade off is that they want carte blanche to enter more strongly into the heart of capitalism and the North American resource sector. Here the Chinese can get all the gold, silver and natural resource deals they want. Doors will quietly swing open and everyone will go home happy. The Chinese will have their desired access to buy gold and natural resource stocks, while The Americans receive a weaker dollar with which to pay off their burgeoning debts. If you are thinking that such a Byzantine arrangement can’t be done, be assured it has all happened before. During the 1980’s the USSR sold large amounts of gold secretly in New York. It took three years to become public knowledge.
Another part of this “Chinamese” agreement concerns rare metals, on which the Chinese head wants to maintain its strategic grip of over 95% of the world’s supply. I feel the U.S. will not make this an issue. The U.S. will accommodate China in order to persuade them to raise the Yuan higher and the dollar lower. I feel this revaluation will be done in a series of two or three steps in 2011, which should eventually move precious metals into new high territories and crush the U.S. dollar. Volatile sell offs in gold and silver like I predicted in November and December, which we are currently experiencing now, may present long term precious metal investors with buying opportunities.
Underneath all of the media hype and adversarial stories between China and America, I read a front page story in the New York Times of 1-17-11, “GE To Share Jet Technology With China In A New Joint Venture.” Expect to hear more deals in 2011 in which the Chinese continue to invest in natural resource assets in North America, while the U.S. continues to search for a way out of the financial crisis.
We may see further bailouts from the federal government as many states are in danger of defaulting. The bankrupt states are already asking Washington for assistance. This devaluation of the dollar that Geithner and Obama are asking for is to help the US pay off its debts and be able to raise its debt ceiling with cheap devalued dollars. This should be bullish for precious metal prices where investors will seek shelter from soaring government deficits and a loss of the U.S. dollar as the world reserve currency. See the iShares S&P National AMT-Free Muni Bond ETF (NYSE:MUB) chart below:
Disclosure None
Bottom Line: Stick With The Juniors In Gold ETFs (GDX, GDXJ, GLD)
In covering the gold sector for my premium subscribers, I have noticed something lately. The large-caps really suck! Ok, that is harsh but it is the truth.
In the chart below I show the large-cap indices. What do you see?
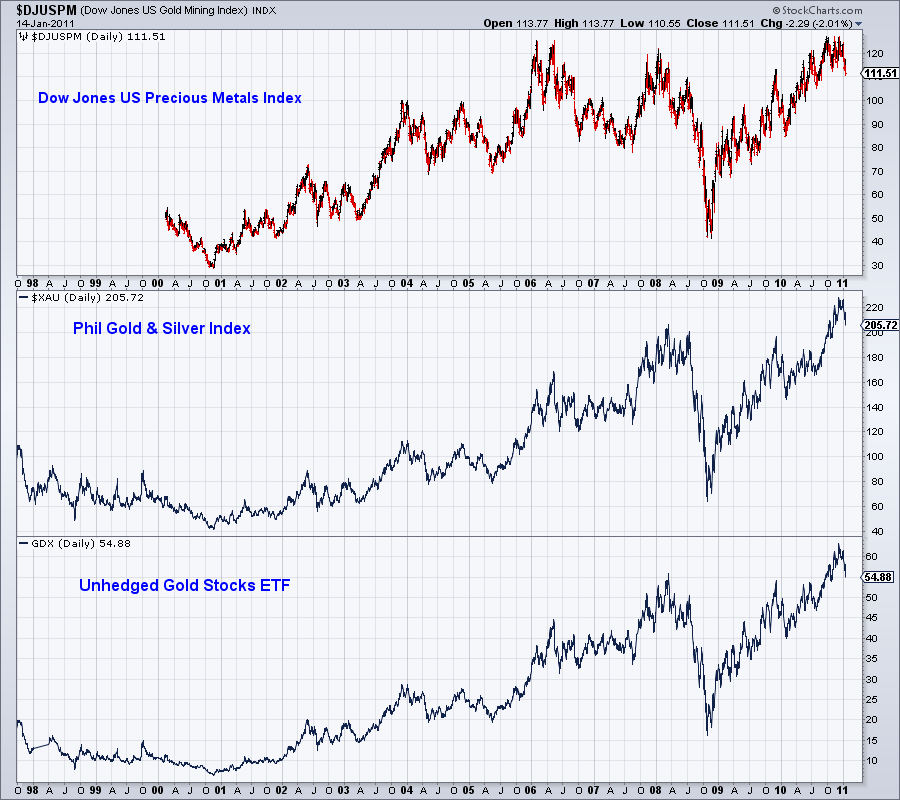
The Dow Jones Precious Metals Index hasn’t gone anywhere for five years, while Gold has m
ore than doubled. The next two the XAU and the Market Vectors Gold Miners ETF (NYSE:GDX) are trading right at their 2008 peaks. Since then, I quickly calculate that Gold and Silver are higher by about 33%.
We all know that the Market Vectors Junior Gold Miners ETF (NYSE:GDXJ) outperformed GDX in 2010. It wasn’t close and even during this correction GDXJ is holding up better.
Yet, GDXJ is weighted heavily in some companies that are above $1 Billion in market cap. Where is the “junior” in that? I created my own index of 25 gold stocks, which are equally weighted and range mostly from $200-$700 million in market cap.
My junior index against the HUI (GDX follows the HUI) is moving higher after an 8-year breakout. This chart tells us that the juniors should outperform strongly in 2011 and likely 2012.

We’ve written about this before but it bears hearing again.
Too often we hear about how gold stocks are cheap and how they are priced for $1000 Gold or $800 Gold. Just because the HUI/Gold or XAU/Gold ratio is low doesn’t mean the sector is at a bottom. The reality is that large gold stocks have consistently underperformed Gold over time. Take a look at this piece from Steve Saville and his chart which goes back to 1960.
Steve attributes the poor performance to rising costs, management errors, environmental and political factors but most importantly, depletion. Just to stay in business gold companies have to consistently find new deposits, mine those deposits and add to reserves. The larger a company is, the more difficult it is to do these things. A junior company can grow by building a few small mines. A large-cap needs to find huge deposits that can become huge mines. It is simply a more difficult business for the larger sized companies.
It is critical that investors and speculators take note of all these factors before partaking in the sector. I fear that the new entrants in the sector will think they are safe by buying Newmont or Barrick. They may be less volatile, but history argues you are better off holding Gold or Silver.
Sure the juniors have already had a fantastic run, but our chart argues that it may be even better in the next few years. As the bull market rages on, the herd will naturally become more speculative. The large players have begun to resort to takeovers and acquisitions. This will continue and further catalyze the junior sector. Related ETF: SPDR Gold Shares ETF (NYSE:GLD)
Disclosure I am long IAU and SLV shares.
In the chart below I show the large-cap indices. What do you see?
The Dow Jones Precious Metals Index hasn’t gone anywhere for five years, while Gold has m
ore than doubled. The next two the XAU and the Market Vectors Gold Miners ETF (NYSE:GDX) are trading right at their 2008 peaks. Since then, I quickly calculate that Gold and Silver are higher by about 33%.
We all know that the Market Vectors Junior Gold Miners ETF (NYSE:GDXJ) outperformed GDX in 2010. It wasn’t close and even during this correction GDXJ is holding up better.
Yet, GDXJ is weighted heavily in some companies that are above $1 Billion in market cap. Where is the “junior” in that? I created my own index of 25 gold stocks, which are equally weighted and range mostly from $200-$700 million in market cap.
My junior index against the HUI (GDX follows the HUI) is moving higher after an 8-year breakout. This chart tells us that the juniors should outperform strongly in 2011 and likely 2012.
We’ve written about this before but it bears hearing again.
Too often we hear about how gold stocks are cheap and how they are priced for $1000 Gold or $800 Gold. Just because the HUI/Gold or XAU/Gold ratio is low doesn’t mean the sector is at a bottom. The reality is that large gold stocks have consistently underperformed Gold over time. Take a look at this piece from Steve Saville and his chart which goes back to 1960.
Steve attributes the poor performance to rising costs, management errors, environmental and political factors but most importantly, depletion. Just to stay in business gold companies have to consistently find new deposits, mine those deposits and add to reserves. The larger a company is, the more difficult it is to do these things. A junior company can grow by building a few small mines. A large-cap needs to find huge deposits that can become huge mines. It is simply a more difficult business for the larger sized companies.
It is critical that investors and speculators take note of all these factors before partaking in the sector. I fear that the new entrants in the sector will think they are safe by buying Newmont or Barrick. They may be less volatile, but history argues you are better off holding Gold or Silver.
Sure the juniors have already had a fantastic run, but our chart argues that it may be even better in the next few years. As the bull market rages on, the herd will naturally become more speculative. The large players have begun to resort to takeovers and acquisitions. This will continue and further catalyze the junior sector. Related ETF: SPDR Gold Shares ETF (NYSE:GLD)
Disclosure I am long IAU and SLV shares.
An ETF Trend-Following Plan For All Seasons
It’s hard to believe that the S&P 500 Index has been flatter than a pancake for the past nine years. It’s had its ups and downs, but when you connect the dots, it went virtually nowhere.
It’s even harder for index investors who relied on this large-cap benchmark to grow their retirement savings. To think, a portfolio with $100,000 allocated to the S&P 500 hardly budged at all. That’s a lot of wasted time and missed opportunity.
That’s why we advocate following trends and actively managing our portfolios using exchange traded funds (ETFs). Whether the broad market travels sideways or falls, a trend is always in the making.
Actually, the term “sideways market” is somewhat misleading. There’s plenty of market activity, but it’s in the form of a sharp downward move, and then a slow recovery period back to its original price level. Only the best and luckiest of timers can get in at the lows and exit at the highs. Otherwise, it can be a very frustrating experience, even for seasoned investors.
Surviving the Dry Season
 A quick review of history shows that there have been dry spells in the market lasting 10 years or more. For example, an investment in stocks making up the S&P 500 Index during the periods from 1929 through 1942 (13 years) and 1966 through 1982 (16 years) would have amounted to no more than a break-even investment.
In this most recent nine-year sideways move, the S&P 500 has fallen in value an average of 0.37% per year, a far cry from the stock market’s historical average annual returns of 10% to 12%.
Many financial advisors focus on your timeframe for growth, but it doesn’t matter if you have five years or 25 years left until retirement. You can’t afford to let your investments sit idle for nine years. Worse yet, an idle investment doesn’t take advantage of the beauty of compounded growth.
No matter what the cause, the market’s recent non-action underscores the inherent danger of the buy-and-hold strategy. Sure, the markets will likely rebound eventually, but that will be of little consolation to investors who need their money now for retirement, or who may have bailed out of the markets at or near the bottom.
The volatile jerks during a sideways market often make investors believe that a market rally has taken hold during highs, only to experience disappointment when yet another sharp downturn occurs. Some who can’t stand the fluctuations get out of the market and sit on the sidelines, often without any plan for how to get back into the market later on.
Countering Volatility With ETFs
So what can an investor do? Well, an ETF investor who follows the trends and sticks to a sell discipline has a whole bunch of options.
 We take advantage of trends that have developed in asset classes, sectors and global regions. Increasing allocation to these areas work well as long as the trend remains intact.
With the growing list of available ETFs and ever-changing trends, we are convinced more than ever that a disciplined investment strategy is required to enhance portfolio returns, diversify and reduce downside risk.
Your strategy, like ours, should be to stick to a plan and not let emotions get involved. Once you start thinking with your heart or gut, it can be hard to kick-start your logic. Even neutralizing emotions will serve any trader well.
You need to know what to buy, when to buy and, as importantly, when to sell.
The Business of Buying and Selling
The first, and perhaps most important screening process for ETFs is knowing the 200-day moving average of each candidate—and where it stands in relation to it. Trend lines are so key that you should only invest in ETFs trading above their 200-day moving averages. You can find this information by clicking on the “basic technical analysis” in the sidebar of any fund information page at finance.yahoo.com.
 We look for uptrends, and then examine those trends using fundamental analysis. Once a position is entered, we stay in the investment until the trend turns negative, declining below its trend line.
In some cases, where trends have moved steeply to the upside, the corresponding ETF may be more than 10% above its moving average. In those cases, we impose an 8% stop-loss. If you buy an ETF trading 15% above its 200-day moving average, it’s best to sell if it drops 8% from a recent high. That way, you preserve as much profit as you can.
You must remember that over time, the stock market and individual securities follow general trends and these trends are identifiable. The idea is that you want to be more fully invested in stocks when the market is above its long-term trend line (200-day moving average). And you want to be safely positioned when the market is trending downward.
Below is a chart of the S&P 500 (NYSEArca: SPY) with its 200-day moving average. You can see that it traded above that mark between 1995-mid-2000, at which point the bear market replaced the bull market. The S&P 500 stayed below its 200-day moving average and kept us out of the market from mid-2000 to mid-2003, then climbed back above from mid-2003 to mid-2004.
 How often we pull the trigger on building or unwinding a position all depends on the ETF and where that ETF lies in relationship to its own moving average and its performance off the high.
Looking at the iShares FTSE/Xinhua 25 (NYSEArca: FXI) chart, for example, if an investor bought in at the beginning of September 2007, they should have sold in the beginning of November 2007 when the ETF fell 8% off of its high. This would have meant a gain of about 25% and would have saved the position from falling further, as it is now about 40% off of its high. By following a sell discipline, one could protect more of the gain and avoid greater losses.

 If an ETF falls below its 200-day moving average, or if it drops 8% off its high without going below its 200-day average, sell it. It’s a rigorous discipline and is applied to all asset classes, sectors and global regions where there is ETF representation. It’s clear-cut, and you know exactly what your risk is.
However, if you don’t have an exit strategy, then your risk tolerance may not be as well-defined. It takes a high tolerance and lots of patience to suffer 20% or more in losses that some sectors and regions have experienced a few times over the last several years.
While we are clear proponents of having an exit strategy, we understand that there can be some confusion when certain ETFs drop quickly and then climb sharply. There’s a chance you might have sold a position that declined further after you sold it but then rebounded.
In this case, don’t beat yourself up over lost opportunity. Just stick to your plan, have no regrets, never look back and keep moving forward.
When this happens, remember that you can treat the cash you have from previously selling an ETF as a “free agent.” This means that there’s no rule that says you must buy back the same ETF you sold if it’s performing well now. Shop around; see where new trends are developing. There might be a different ETF that’s even better for your portfolio now.
Sharp market movements and subsequent ETF declines can unsettle many investors. However, with an exit strategy and specific stop-loss points, the drops can be less stressful for you as it prevents small losses from turning into there-goes-my-house losses.
There have always been and will always be bubbles, and the only sure way you can protect yourself is to have an exit strategy always at the ready.
If an ETF you’re holding – whether it’s commodities or something else – drops below its trend line or falls 8% off its high, let it go, no questions asked.
A lesser stop-loss, such as 5%, could be too low since markets often have a 3% to 5% correction before they move on and hit new highs. If your stop loss is too low, for example, at 3%, you’re going to be buying and selling more frequently, racking up fees in the process.
Ultimately, that eats up your returns. You also won’t be able to fully take advantage of trends. Instead, you’ll be dealing with constant short-lived whipsaws. Sometimes there are volatile days in the middle of an overall uptrend, and it’s in your best interest to ride those out.
On the other hand, having a sell point that’s too high can also hurt you. Setting your sell point at 30% could mean that you lose a significant portion of money before you’re out. It also has you sitting in areas that might not be performing so well and missing out on areas that are trending up.
 It can be difficult to let go of a mover and shaker you’ve always had a soft spot for, but if you want to protect your money, you must. It’s like your parents always said when they were grounding you every other week: “This hurts me more than it hurts you.” But sometimes it has to be done for everyone’s good.
There are no guarantees that when you let a fund go, it’s not going to turn around and deliver the numbers again. But that doesn’t mean it won’t, either. It’s exactly why you have to remain as stoic as possible and stick to the plan and rationalize nothing.
What if you follow your exit strategy, and the ETFs you sell end up rebounding? Try this:
With the recent volatility in the markets, we have seen some price swings in ETFs. One shouldn’t worry about the daily ETF price movement; having an investment plan is the priority. When there is a discipline in place, it can help guide investors through the volatile times.
If you’ve got nervous hands as your ETFs swing up one day and down the next, the best thing you could do is to just sit on them.
Removing the emotions from your investing is one of the smartest things you can do.
And, as we’ve said, having a strategy and removing your feelings from your money is especially timely, considering the ups and downs can make you feel sick.
The Anatomy of a Bursting Bubble—Here and Abroad
 Investors and economists often use history as gauge for what might happen today and in the future. Could we have studied the onset of a 14-year bear market in Japan to predict the dot-com crash and subsequent bear in the U.S.? And, what do both events say about today’s economy and markets?
Let’s take a look back.
In the 1980s, outsiders perceived Japan as a utopia because its people had the highest quality of life and longest life expectancy. In addition, Japan was the world’s largest creditor and had the highest GDP per capita. Many Americans feared that Japanese-made robots would eliminate their jobs. With the economy booming and the stock market climbing, skyscrapers filled the Tokyo and Osaka skies, causing real estate prices to skyrocket as well.
Between 1986 and 1988, the price of commercial land in greater Tokyo doubled. Real estate prices soared so much that Tokyo alone was worth more than the United States. Between 1955 and 1990, land prices in Japan appreciated by 70 times and stocks increased 100 times over. Large-scale stock speculation led to worldwide mania. Investors all over the world clamored for Japanese shares. These euphoric investors believed in a perpetual bull market. Luxury goods were purchased in large numbers by the newly wealthy.
Unfortunately, all excessively good things must end. To cool the inflated economy, the Japanese government raised rates. Within months, the Nikkei stock index crashed by more than 30,000 points. The Nikkei crashed this far because its value was inflated on false hopes and hype, not solid financials. Japanese housing prices plummeted for 14 straight years. At its height, the Nikkei stood at 40,000. The Nikkei sank until its low of 8,000 in 2003.
Dot-com Déjà vu
Back at home, we experienced a similar crash, but one not nearly as lengthy or devastating as that of Japan’s: the dot-com crash, which began on March 11, 2000 and lasted until Oct. 9, 2002. From peak to valley, the Nasdaq lost 78% of its value as it fell from 5046.86 to 1114.11.
 The U.S. military created the Internet decades before “dot-com” became a household word. Vastly underestimating how much people would want to be online, it began to catch on in 1995 with an estimated 18 million users. Soon, speculators were barely able to control their excitement over this new economy. Today, 210 million people in China-alone go online, 50 million users shy of the United States.
The first holes in this bubble came from the companies themselves: Many reported huge losses and some folded outright within months of their offering. In 1999, there were 457 IPOs, most of which were Internet- and technology-related. Of those 457 IPOs, 117 doubled in price on the first day of trading. In 2001, the number of IPOs shrank to 76, and none of them doubled on the first day of trading.
Many argue that the dot-com boom and bust was a case of too much too fast. Companies unable to decide on their corporate creed were given millions of dollars and told to grow to Microsoft size by tomorrow.
Unfortunately, economic and “unanticipated” risks will always be there. Investors hate uncertainty, and since we can’t always identify them in advance or eliminate them, there will be times when they affect the investment markets negatively.
If you follow a buy-and-hold strategy, you leave your portfolio vulnerable to any number of unknowns: oil spikes to $200/barrel, the Middle East erupts into war, The Fed makes a drastic move with interest rates. With an exit strategy, you’re prepared to cut losses or pocket profits when events send the markets lower.
Risks Without Reward
During the 1990s, many investors believed that the stock markets would produce returns of 20% (or more) per year indefinitely, which was a part of the herd mentality back then. Same goes for the late 1970s and early ’80s, when investors thought bank certificates of deposit and fixed annuities would always have double-digit yields—two assumptions that were clearly wrong.
If your expectations for portfolio returns are too high, there is a very good chance your financial goals will not be met. And more importantly, this can lead to saving too little money to meet your retirement goals. Unfortunately, this can also lead to investing in securities and strategies that are far too risky in order to try to “turbo-charge” the returns.
On the flip side, there are investors who invest too conservatively and risk losing purchasing power to inflation. Investing too conservatively can also raise the odds of not meeting investment goals, as well as the risk of outliving your assets.
 So, we find ourselves at another crossroads in the markets. Real estate exuberance, based on inflated prices, has gone sour along with values; financial institutions have turned from princes to frogs in a matter of months; consumer debt is at all-time highs, and investors grow increasingly frustrated with the lack of opportunities the current stock markets offer.
But investors who combine the flexibility, diversity and ease-of-use of ETFs with a disciplined buy and sell plan don’t have to fret about all the outside influences on the markets. You can turn a deaf ear to financial hype and keep emotions out of the investing equation.
That’s because the simple, technical indicator—the 200-day moving average—tells us precisely when to buy and when to sell. Even when it seems like the entire market is down, you can count on there being a trend-bucking ETF ripe for the picking.
What the Opportunities Look Like
The S&P 500 and Dow have been trading below their 200-day moving averages for all or most of the year. Meanwhile, gold, oil, steel, and agriculture ETFs have traded above their respective 200-day marks and offered investment opportunities in 2008.


 g
g
Disclosure I am Long SPY.
It’s even harder for index investors who relied on this large-cap benchmark to grow their retirement savings. To think, a portfolio with $100,000 allocated to the S&P 500 hardly budged at all. That’s a lot of wasted time and missed opportunity.
That’s why we advocate following trends and actively managing our portfolios using exchange traded funds (ETFs). Whether the broad market travels sideways or falls, a trend is always in the making.
Actually, the term “sideways market” is somewhat misleading. There’s plenty of market activity, but it’s in the form of a sharp downward move, and then a slow recovery period back to its original price level. Only the best and luckiest of timers can get in at the lows and exit at the highs. Otherwise, it can be a very frustrating experience, even for seasoned investors.
Surviving the Dry Season
A quick review of history shows that there have been dry spells in the market lasting 10 years or more. For example, an investment in stocks making up the S&P 500 Index during the periods from 1929 through 1942 (13 years) and 1966 through 1982 (16 years) would have amounted to no more than a break-even investment.In this most recent nine-year sideways move, the S&P 500 has fallen in value an average of 0.37% per year, a far cry from the stock market’s historical average annual returns of 10% to 12%.
Many financial advisors focus on your timeframe for growth, but it doesn’t matter if you have five years or 25 years left until retirement. You can’t afford to let your investments sit idle for nine years. Worse yet, an idle investment doesn’t take advantage of the beauty of compounded growth.
No matter what the cause, the market’s recent non-action underscores the inherent danger of the buy-and-hold strategy. Sure, the markets will likely rebound eventually, but that will be of little consolation to investors who need their money now for retirement, or who may have bailed out of the markets at or near the bottom.
The volatile jerks during a sideways market often make investors believe that a market rally has taken hold during highs, only to experience disappointment when yet another sharp downturn occurs. Some who can’t stand the fluctuations get out of the market and sit on the sidelines, often without any plan for how to get back into the market later on.
Countering Volatility With ETFs
So what can an investor do? Well, an ETF investor who follows the trends and sticks to a sell discipline has a whole bunch of options.
We take advantage of trends that have developed in asset classes, sectors and global regions. Increasing allocation to these areas work well as long as the trend remains intact.With the growing list of available ETFs and ever-changing trends, we are convinced more than ever that a disciplined investment strategy is required to enhance portfolio returns, diversify and reduce downside risk.
Your strategy, like ours, should be to stick to a plan and not let emotions get involved. Once you start thinking with your heart or gut, it can be hard to kick-start your logic. Even neutralizing emotions will serve any trader well.
You need to know what to buy, when to buy and, as importantly, when to sell.
Three Main RulesHere are three rules that should help keep most ETF investors out of trouble:
- Maintain an 8% stop-loss on your ETFs.
- Keep an eye on the trend. If your ETF declines below its 50-day average, that’s not a good sign. If the same ETF declines below its 200-day average, sell.
- Don’t chase markets that are too hot. The last time many world markets and industry groups collectively hit new highs was in 2000. You know what happened then – the boom went bust. Keep your emotions in check.
The Business of Buying and Selling
The first, and perhaps most important screening process for ETFs is knowing the 200-day moving average of each candidate—and where it stands in relation to it. Trend lines are so key that you should only invest in ETFs trading above their 200-day moving averages. You can find this information by clicking on the “basic technical analysis” in the sidebar of any fund information page at finance.yahoo.com.
We look for uptrends, and then examine those trends using fundamental analysis. Once a position is entered, we stay in the investment until the trend turns negative, declining below its trend line.In some cases, where trends have moved steeply to the upside, the corresponding ETF may be more than 10% above its moving average. In those cases, we impose an 8% stop-loss. If you buy an ETF trading 15% above its 200-day moving average, it’s best to sell if it drops 8% from a recent high. That way, you preserve as much profit as you can.
You must remember that over time, the stock market and individual securities follow general trends and these trends are identifiable. The idea is that you want to be more fully invested in stocks when the market is above its long-term trend line (200-day moving average). And you want to be safely positioned when the market is trending downward.
Below is a chart of the S&P 500 (NYSEArca: SPY) with its 200-day moving average. You can see that it traded above that mark between 1995-mid-2000, at which point the bear market replaced the bull market. The S&P 500 stayed below its 200-day moving average and kept us out of the market from mid-2000 to mid-2003, then climbed back above from mid-2003 to mid-2004.
Looking at the iShares FTSE/Xinhua 25 (NYSEArca: FXI) chart, for example, if an investor bought in at the beginning of September 2007, they should have sold in the beginning of November 2007 when the ETF fell 8% off of its high. This would have meant a gain of about 25% and would have saved the position from falling further, as it is now about 40% off of its high. By following a sell discipline, one could protect more of the gain and avoid greater losses.
Resolve To Protect and ProfitExiting An ETF…Safely and Profitably
Momentum can certainly turn on a dime. Just look at the health care sector in 1991 as an example. It was up 50% for that year, but the following year it was down 19%.
Whatever trend you’re following, just be sure to take a disciplined approach and remember to follow through with your strategy.
- Resolve to stick to your discipline. We know the past year has been rocky, and it is hard not to get emotional. We can’t predict the future, so we don’t know what’s in store for the rest of 2008. One way to avoid pulling every last hair out of your head in frustration over the uncertainty is to have a plan and adhere to it no matter what.
- Resolve to pay attention to the news. Political upheaval, major weather events and leadership changes are among the things that can indirectly affect your holdings. Don’t just isolate yourself to the business section.
- Resolve to pay attention to your investments. Are you coming up on a major life change, such as having children or entering the homestretch before retirement? Look at your portfolio and make sure it’s still working for you.
- Resolve not to invest in something simply because it’s “hot.” That’s the best way to get burned. Invest because it fits your needs, interests and your portfolio.
If an ETF falls below its 200-day moving average, or if it drops 8% off its high without going below its 200-day average, sell it. It’s a rigorous discipline and is applied to all asset classes, sectors and global regions where there is ETF representation. It’s clear-cut, and you know exactly what your risk is.However, if you don’t have an exit strategy, then your risk tolerance may not be as well-defined. It takes a high tolerance and lots of patience to suffer 20% or more in losses that some sectors and regions have experienced a few times over the last several years.
While we are clear proponents of having an exit strategy, we understand that there can be some confusion when certain ETFs drop quickly and then climb sharply. There’s a chance you might have sold a position that declined further after you sold it but then rebounded.
In this case, don’t beat yourself up over lost opportunity. Just stick to your plan, have no regrets, never look back and keep moving forward.
When this happens, remember that you can treat the cash you have from previously selling an ETF as a “free agent.” This means that there’s no rule that says you must buy back the same ETF you sold if it’s performing well now. Shop around; see where new trends are developing. There might be a different ETF that’s even better for your portfolio now.
Sharp market movements and subsequent ETF declines can unsettle many investors. However, with an exit strategy and specific stop-loss points, the drops can be less stressful for you as it prevents small losses from turning into there-goes-my-house losses.
There have always been and will always be bubbles, and the only sure way you can protect yourself is to have an exit strategy always at the ready.
If an ETF you’re holding – whether it’s commodities or something else – drops below its trend line or falls 8% off its high, let it go, no questions asked.
A lesser stop-loss, such as 5%, could be too low since markets often have a 3% to 5% correction before they move on and hit new highs. If your stop loss is too low, for example, at 3%, you’re going to be buying and selling more frequently, racking up fees in the process.
Ultimately, that eats up your returns. You also won’t be able to fully take advantage of trends. Instead, you’ll be dealing with constant short-lived whipsaws. Sometimes there are volatile days in the middle of an overall uptrend, and it’s in your best interest to ride those out.
On the other hand, having a sell point that’s too high can also hurt you. Setting your sell point at 30% could mean that you lose a significant portion of money before you’re out. It also has you sitting in areas that might not be performing so well and missing out on areas that are trending up.
What If You Missed The Safety Boat?
What should you do if you missed the 8% drop, and you’re down much further than that? Missing the sell point creates the conundrum above. That’s when I recommend the following:
- Sell 1/3 of your equity holdings and focus on the most aggressive positions—those that might be down 20-30% and trading 10-15% below their 200-day moving averages.
- If those holdings decline by another 5-7%, consider selling another third.
- Keep an eye on the 200-day average of these positions. As the trend lines continue to decline, there will be an excellent buying opportunity in the future when the markets eventually rebound.
It can be difficult to let go of a mover and shaker you’ve always had a soft spot for, but if you want to protect your money, you must. It’s like your parents always said when they were grounding you every other week: “This hurts me more than it hurts you.” But sometimes it has to be done for everyone’s good.There are no guarantees that when you let a fund go, it’s not going to turn around and deliver the numbers again. But that doesn’t mean it won’t, either. It’s exactly why you have to remain as stoic as possible and stick to the plan and rationalize nothing.
What if you follow your exit strategy, and the ETFs you sell end up rebounding? Try this:
- Treat the newly available cash as “free agent” funds. Just because you sold an ETF doesn’t mean you’re obligated to buy it back when it rebounds.
- Look for ETFs that are above or rising above their trend lines.
- Look for ETFs with positive, relative strength. When markets rebound off a low, it’s usually those with the greatest momentum that enjoy sustained uptrends.
With the recent volatility in the markets, we have seen some price swings in ETFs. One shouldn’t worry about the daily ETF price movement; having an investment plan is the priority. When there is a discipline in place, it can help guide investors through the volatile times.
If you’ve got nervous hands as your ETFs swing up one day and down the next, the best thing you could do is to just sit on them.
Removing the emotions from your investing is one of the smartest things you can do.
And, as we’ve said, having a strategy and removing your feelings from your money is especially timely, considering the ups and downs can make you feel sick.
The Anatomy of a Bursting Bubble—Here and Abroad
Investors and economists often use history as gauge for what might happen today and in the future. Could we have studied the onset of a 14-year bear market in Japan to predict the dot-com crash and subsequent bear in the U.S.? And, what do both events say about today’s economy and markets?Let’s take a look back.
In the 1980s, outsiders perceived Japan as a utopia because its people had the highest quality of life and longest life expectancy. In addition, Japan was the world’s largest creditor and had the highest GDP per capita. Many Americans feared that Japanese-made robots would eliminate their jobs. With the economy booming and the stock market climbing, skyscrapers filled the Tokyo and Osaka skies, causing real estate prices to skyrocket as well.
Between 1986 and 1988, the price of commercial land in greater Tokyo doubled. Real estate prices soared so much that Tokyo alone was worth more than the United States. Between 1955 and 1990, land prices in Japan appreciated by 70 times and stocks increased 100 times over. Large-scale stock speculation led to worldwide mania. Investors all over the world clamored for Japanese shares. These euphoric investors believed in a perpetual bull market. Luxury goods were purchased in large numbers by the newly wealthy.
Unfortunately, all excessively good things must end. To cool the inflated economy, the Japanese government raised rates. Within months, the Nikkei stock index crashed by more than 30,000 points. The Nikkei crashed this far because its value was inflated on false hopes and hype, not solid financials. Japanese housing prices plummeted for 14 straight years. At its height, the Nikkei stood at 40,000. The Nikkei sank until its low of 8,000 in 2003.
Dot-com Déjà vu
Back at home, we experienced a similar crash, but one not nearly as lengthy or devastating as that of Japan’s: the dot-com crash, which began on March 11, 2000 and lasted until Oct. 9, 2002. From peak to valley, the Nasdaq lost 78% of its value as it fell from 5046.86 to 1114.11.
The U.S. military created the Internet decades before “dot-com” became a household word. Vastly underestimating how much people would want to be online, it began to catch on in 1995 with an estimated 18 million users. Soon, speculators were barely able to control their excitement over this new economy. Today, 210 million people in China-alone go online, 50 million users shy of the United States.The first holes in this bubble came from the companies themselves: Many reported huge losses and some folded outright within months of their offering. In 1999, there were 457 IPOs, most of which were Internet- and technology-related. Of those 457 IPOs, 117 doubled in price on the first day of trading. In 2001, the number of IPOs shrank to 76, and none of them doubled on the first day of trading.
Many argue that the dot-com boom and bust was a case of too much too fast. Companies unable to decide on their corporate creed were given millions of dollars and told to grow to Microsoft size by tomorrow.
Unfortunately, economic and “unanticipated” risks will always be there. Investors hate uncertainty, and since we can’t always identify them in advance or eliminate them, there will be times when they affect the investment markets negatively.
If you follow a buy-and-hold strategy, you leave your portfolio vulnerable to any number of unknowns: oil spikes to $200/barrel, the Middle East erupts into war, The Fed makes a drastic move with interest rates. With an exit strategy, you’re prepared to cut losses or pocket profits when events send the markets lower.
Risks Without Reward
During the 1990s, many investors believed that the stock markets would produce returns of 20% (or more) per year indefinitely, which was a part of the herd mentality back then. Same goes for the late 1970s and early ’80s, when investors thought bank certificates of deposit and fixed annuities would always have double-digit yields—two assumptions that were clearly wrong.
If your expectations for portfolio returns are too high, there is a very good chance your financial goals will not be met. And more importantly, this can lead to saving too little money to meet your retirement goals. Unfortunately, this can also lead to investing in securities and strategies that are far too risky in order to try to “turbo-charge” the returns.
On the flip side, there are investors who invest too conservatively and risk losing purchasing power to inflation. Investing too conservatively can also raise the odds of not meeting investment goals, as well as the risk of outliving your assets.
So, we find ourselves at another crossroads in the markets. Real estate exuberance, based on inflated prices, has gone sour along with values; financial institutions have turned from princes to frogs in a matter of months; consumer debt is at all-time highs, and investors grow increasingly frustrated with the lack of opportunities the current stock markets offer.But investors who combine the flexibility, diversity and ease-of-use of ETFs with a disciplined buy and sell plan don’t have to fret about all the outside influences on the markets. You can turn a deaf ear to financial hype and keep emotions out of the investing equation.
That’s because the simple, technical indicator—the 200-day moving average—tells us precisely when to buy and when to sell. Even when it seems like the entire market is down, you can count on there being a trend-bucking ETF ripe for the picking.
What the Opportunities Look Like
The S&P 500 and Dow have been trading below their 200-day moving averages for all or most of the year. Meanwhile, gold, oil, steel, and agriculture ETFs have traded above their respective 200-day marks and offered investment opportunities in 2008.
Disclosure I am Long SPY.
Bond ETFs Are Good…If You Understand Them
If you’ve eyed the current 4.57% yield on the 30-year Treasury bond, you might be tempted to buy. But hold on: chasing yields in your exchange traded funds (ETFs) can hurt you if you’re not careful.
In hopes of getting halfway decent yields, millions of investors have gone far out on the curve. However, bonds and bond ETFs aren’t insured by the Federal Deposit Insurance Corporation (FDIC), so you’re at risk of losing principal when the Federal Reserve raises rates.
Short-term bond ETFs don’t have the most appealing yields – 3-month bonds are 0.12%; 3-year bonds are 1% – but they will be less impacted when rates jump.
Constance Gustke at Bankrate drilled down into a few of the pros and cons when it comes to bond ETFs:
Disclosure none
In hopes of getting halfway decent yields, millions of investors have gone far out on the curve. However, bonds and bond ETFs aren’t insured by the Federal Deposit Insurance Corporation (FDIC), so you’re at risk of losing principal when the Federal Reserve raises rates.
Short-term bond ETFs don’t have the most appealing yields – 3-month bonds are 0.12%; 3-year bonds are 1% – but they will be less impacted when rates jump.
Constance Gustke at Bankrate drilled down into a few of the pros and cons when it comes to bond ETFs:
- Pro: They’re liquid – you can buy and sell them anytime markets are open.
- Pro: There are so many options – any type of bond is now available in ETF form, and there’s about to be more soon: BulletShares is launching a suite of BulletShares High Yield Corporate Bond ETFs on Thursday.
- Con: You can lose money. Bonds are considered “safe” relative to other investments, but that doesn’t mean they won’t hurt you.
- Con: There’s risk. It ranges from safe (Treasuries) to super risky (junk bonds).
Disclosure none
retirement landscape and things look pretty darn dire
Take a quick survey of the retirement landscape and things look pretty darn dire. According to a survey conducted by Wells Fargo last month, the average American has managed to save a meager 7 percent of the amount they’d like to have in their Golden Years. That fact alone is bad enough. But what’s worse is that I think even their “ideal” amount is WAY too low!
The average “middle class” survey respondent said they would need $300,000 to fund their retirement. Keep in mind, this is how Wells Fargo defined “middle class” …
Let’s imagine there are two adults in the home, roughly 50 years old each based on this survey.
Even if they’re not carrying any serious debt, they haven’t managed to save anywhere near their targeted amount … so it’s safe to say they’re spending almost all of their annual income as it comes in.
Now, are they likely to slash their expenditures as they continue to age? And is it reasonable for them to expect health care costs, energy prices, and food bills to stay what they are today?
I’d say no to both of those questions. Yet even their magical target of a $300,000 nest egg represents just a bit more than four years of their current expenditures.
No wonder one in every three respondents also said they will have to keep working during their golden years to support themselves! I’m probably preaching to the choir here, and I’m sure you’re in much better shape than the typical American retiree-to-be. At the same time, I think it’s fair to say that there’s no such thing as being TOO prepared or having a nest egg that’s TOO big. Which is why I want to give you …
Four Simple Steps to a Richer Retirement Nest Egg, Whether You’re Already Ahead or Trying to Play Catch-Up
It doesn’t matter what age you are right now … how much you’ve already saved … or how far away from your goals you are right now. You absolutely want to make sure that you’ve got a plan in place, and that you’re sticking to it. And the following four basic steps are a great starting point for building a better retirement nest egg without sacrificing safety …
Step #1: Before you do anything else, make sure you have a safe, liquid emergency cash fund.
Sure, I encourage 401(k) participants to at least contribute enough to get the maximum company match. And yes, I implore people to take maximum advantage of other tax shelters like IRAs, too.
But I don’t think anyone should be retirement rich and cash poor!
It simply doesn’t make sense to plow your money into long-term accounts like 401(k)s and IRAs if there’s a chance you may have to withdraw those same funds in short order in the event of an emergency. Not only will you likely be invested in less liquid investments but you could possibly face additional taxes and penalties, too.
So you absolutely want to make sure you have a solid emergency fund in place before you contribute another penny to your retirement nest egg.
Ideally, it will represent a full years’ worth of your current expenses or income but I would recommend three months as the bare minimum.
And even though you’ll get near-zero returns, I suggest keeping your emergency funds in a plain vanilla savings account, Treasury-only money market fund, or similar cash equivalent.
After all, the goal here is maximum safety and liquidity. You never know when you or a family member might need money due to a job loss, illness or busted water heater!
Once you have your liquid fund in place, of course, it’s time to start investing the rest of your nest egg for maximum income and growth …
Step #2: For your U.S. investments, stick mostly to conservative dividend-paying stocks right now.
I’ve said it before, but it bears repeating: With interest rates still near record lows, most bonds, CDs, and money market funds simply aren’t paying enough to warrant owning them in your long-term investment accounts.
Plus, given the fiscal mess here in this country — at the federal, state and local levels! — there is a substantial risk of further losses for many government bondholders going forward.
So if you want the biggest, safest yields here in the U.S., I continue to think conservative dividend shares represent your best option.
As I’ve pointed out time and again — these types of investments not only kick off stable, growing cash streams … they also offer you the chance for long-term investment gains, too.
And even if you don’t to go about picking individual companies, you can always own a broad swath of solid income stocks through vehicles like the PowerShares Dividend Achievers (NYSE:PFM) exchange-traded fund.
Step #3: Add some foreign dividend shares, too.
It’s no longer enough for us to invest solely in the U.S. — the world is becoming a smaller and smaller place … some economies overseas are expanding at much faster rates than those in the traditional places … and it’s getting more important to diversify your portfolio as much as possible.
This is precisely why I’ve been recommending select foreign dividend stocks even for my own father’s retirement account!
By holding the U.S.-listed shares of foreign corporations you can quickly and easily access new worlds of growth.
Better yet, because your shares (and dividends) are originally priced in foreign currencies, you have the unique opportunity to profit further whenever the U.S. dollar moves lower relative to the listing company’s home currency.
Again, there are even exchange-traded funds that will give you all-in-one-shot access to these global dividend stocks — including the S&P International Dividend ETF (NYSE:DWX).
And that brings me to a bigger point …
Step #4: Learn all you can about other alternative investments and strategies, too!
It’s important to stay on top of the latest investments that are becoming available … especially if you’re looking for unique new ways to hedge your traditional holdings or for new vehicles to use in the more aggressive part of your portfolio.
Disclosure None
The average “middle class” survey respondent said they would need $300,000 to fund their retirement. Keep in mind, this is how Wells Fargo defined “middle class” …
- Ages 30 to 69: Household income between $40,000 and $100,000 or investable assets of $25,000 and $100,000
- Ages 25 to 29: Household income or investable assets between $25,000 and $100,000
Let’s imagine there are two adults in the home, roughly 50 years old each based on this survey.
Even if they’re not carrying any serious debt, they haven’t managed to save anywhere near their targeted amount … so it’s safe to say they’re spending almost all of their annual income as it comes in.
Now, are they likely to slash their expenditures as they continue to age? And is it reasonable for them to expect health care costs, energy prices, and food bills to stay what they are today?
I’d say no to both of those questions. Yet even their magical target of a $300,000 nest egg represents just a bit more than four years of their current expenditures.
No wonder one in every three respondents also said they will have to keep working during their golden years to support themselves! I’m probably preaching to the choir here, and I’m sure you’re in much better shape than the typical American retiree-to-be. At the same time, I think it’s fair to say that there’s no such thing as being TOO prepared or having a nest egg that’s TOO big. Which is why I want to give you …
Four Simple Steps to a Richer Retirement Nest Egg, Whether You’re Already Ahead or Trying to Play Catch-Up
It doesn’t matter what age you are right now … how much you’ve already saved … or how far away from your goals you are right now. You absolutely want to make sure that you’ve got a plan in place, and that you’re sticking to it. And the following four basic steps are a great starting point for building a better retirement nest egg without sacrificing safety …
Step #1: Before you do anything else, make sure you have a safe, liquid emergency cash fund.
Sure, I encourage 401(k) participants to at least contribute enough to get the maximum company match. And yes, I implore people to take maximum advantage of other tax shelters like IRAs, too.
But I don’t think anyone should be retirement rich and cash poor!
It simply doesn’t make sense to plow your money into long-term accounts like 401(k)s and IRAs if there’s a chance you may have to withdraw those same funds in short order in the event of an emergency. Not only will you likely be invested in less liquid investments but you could possibly face additional taxes and penalties, too.
So you absolutely want to make sure you have a solid emergency fund in place before you contribute another penny to your retirement nest egg.
Ideally, it will represent a full years’ worth of your current expenses or income but I would recommend three months as the bare minimum.
And even though you’ll get near-zero returns, I suggest keeping your emergency funds in a plain vanilla savings account, Treasury-only money market fund, or similar cash equivalent.
After all, the goal here is maximum safety and liquidity. You never know when you or a family member might need money due to a job loss, illness or busted water heater!
Once you have your liquid fund in place, of course, it’s time to start investing the rest of your nest egg for maximum income and growth …
Step #2: For your U.S. investments, stick mostly to conservative dividend-paying stocks right now.
I’ve said it before, but it bears repeating: With interest rates still near record lows, most bonds, CDs, and money market funds simply aren’t paying enough to warrant owning them in your long-term investment accounts.
Plus, given the fiscal mess here in this country — at the federal, state and local levels! — there is a substantial risk of further losses for many government bondholders going forward.
So if you want the biggest, safest yields here in the U.S., I continue to think conservative dividend shares represent your best option.
As I’ve pointed out time and again — these types of investments not only kick off stable, growing cash streams … they also offer you the chance for long-term investment gains, too.
And even if you don’t to go about picking individual companies, you can always own a broad swath of solid income stocks through vehicles like the PowerShares Dividend Achievers (NYSE:PFM) exchange-traded fund.
Step #3: Add some foreign dividend shares, too.
It’s no longer enough for us to invest solely in the U.S. — the world is becoming a smaller and smaller place … some economies overseas are expanding at much faster rates than those in the traditional places … and it’s getting more important to diversify your portfolio as much as possible.
This is precisely why I’ve been recommending select foreign dividend stocks even for my own father’s retirement account!
By holding the U.S.-listed shares of foreign corporations you can quickly and easily access new worlds of growth.
Better yet, because your shares (and dividends) are originally priced in foreign currencies, you have the unique opportunity to profit further whenever the U.S. dollar moves lower relative to the listing company’s home currency.
Again, there are even exchange-traded funds that will give you all-in-one-shot access to these global dividend stocks — including the S&P International Dividend ETF (NYSE:DWX).
And that brings me to a bigger point …
Step #4: Learn all you can about other alternative investments and strategies, too!
It’s important to stay on top of the latest investments that are becoming available … especially if you’re looking for unique new ways to hedge your traditional holdings or for new vehicles to use in the more aggressive part of your portfolio.
Disclosure None
Subscribe to:
Posts (Atom)