click to enlarge
In this article, we move on to small cap blend ETFs with the goal of providing the same ranking.
We rank and determine a cutoff based on trading volume for liquidity and lowtrading friction, then rank them based on their returns and assign a score. We start with a fuller list of small cap blend ETFs:
| Symbol | Name |
| IWM | iShares Russell 2000 Index |
| IJR | iShares S&P SmallCap 600 Index |
| VB | Vanguard Small Cap ETF |
| IWC | iShares Russell Microcap Index |
| SCHA | Schwab U.S. Small-Cap ETF |
| PRFZ | PowerShares FTSE RAFI US 1500 |
| JKJ | iShares Morningstar Small Core |
| RWJ | RevenueShares Small Cap |
| PZI | PowerShares Zacks Micro Cap |
| FYX | First Trust Small Cap Core Alp |
| FDM | First Trust Dow Jones Select M |
| SLY | SPDR S&P 600 Small Cap ETF |
| WMCR | Wilshire Micro-Cap ETF |
| VTWO | Vanguard Russell 2000 Index ET |
| PJM | PowerShares Dynamic Small Cap |
| EWRS | Rydex Russell 2000 Equal Weigh |
| VIOO | Vanguard S&P Small-Cap 600 Ind |
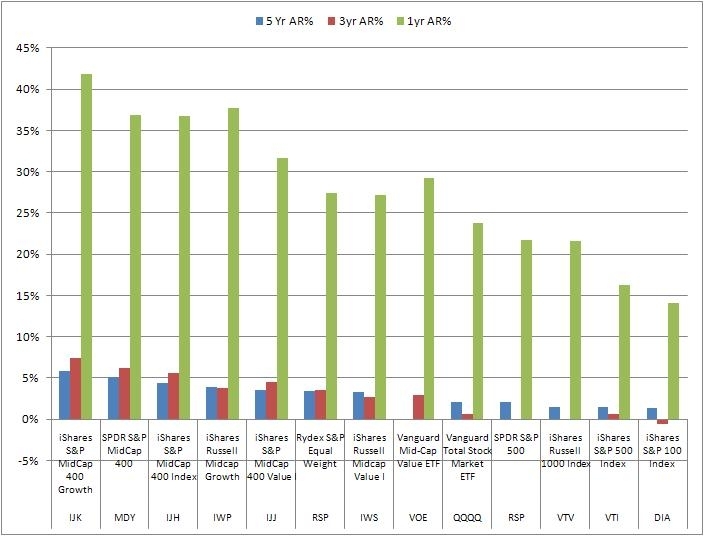
| Ticker | Description | 5 Yr AR% | 3yr AR% | 1yr AR% |
| VB | Vanguard Small Cap ETF | 4.00% | 5.40% | 37.07% |
| IJR | iShares S&P SmallCap 600 Idx | 2.83% | 4.37% | 35.61% |
| IWM | iShares Russell 2000 Index | 2.26% | 3.50% | 29.63% |
| IWC | iShares Russell Microcap Index | -1.89% | 0.74% | 35.77% |
| SCHA | Schwab U.S. Small-Cap ETF | 0.00% | 0.00% | 32.36% |
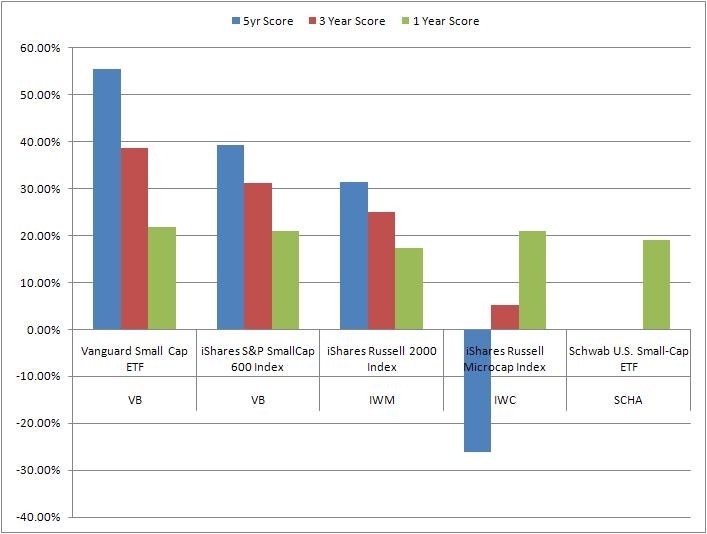
We will select the top three although VB and IJR seem to be head and shoulders above the rest of the bunch.
| Ticker | Property | 2004 | 2005 | 2006 | 2007 | 2008 | 2009 | 2010 | 2011 |
| VB | Draw Down(%) | 12.00 | 9.04 | 13.15 | 13.31 | 51.92 | 32.54 | 20.01 | 3.69 |
| Return(%) | 15.29 | 7.10 | 15.50 | 0.96 | (37.61) | 36.39 | 28.58 | 3.19 | |
| IJR | Draw Down(%) | 11.07 | 10.94 | 13.98 | 14.44 | 48.42 | 33.34 | 19.29 | 3.58 |
| Return(%) | 21.43 | 6.57 | 14.17 | (1.47) | (31.70) | 24.45 | 27.33 | 2.13 | |
| IWM | Draw Down(%) | 14.41 | 12.16 | 14.14 | 13.90 | 49.44 | 32.90 | 20.09 | 4.23 |
| Return(%) | 16.88 | 3.04 | 16.95 | (2.73) | (34.48) | 26.81 | 26.49 | 1.55 |
So VB and IJR are selected for Mid Cap Blend ETFs.
I have no positions in any stocks mentioned, but plan to initiate a long position in IWM over the next 72 hours.
No comments:
Post a Comment